x <- 10Controlling flow
Conditionals in functions are used to modify how a function runs, determine what output to return or to return warnings and errors depending on logical statements. We’ll look at if and else, as well as functions for combining multiple logical statements. if and else can be used instead of stopifnot, usually in cases where logical statements are more complex or a more elaborate error message is required.
The following functions are essential for controlling flow in R:
-
ifelse(andelse if) -
||,&&combine multiple logical expressions and short-circuit when||sees the first true and&&sees the first false -
|,&are vectorized and cannot be directly used in anifstatement unless you also useany,all
Exercises: function conditionals
Conditional statements
Instruction: write a series of if else conditional statements for the following objects then consult the solution to check your work.
Numeric
- if x is a numeric, return x as a character
- print ‘positive’ if x is greater than 0, else print ‘negative’ if x is less than 0
- if x / 3 returns a remainder (hint: see
?`%%`), print the remainder
Show solution
data.frame
- return the column ‘colors’ if it exists in DF
- if type is ‘histogram’, plot a histogram of DF’s column ‘numbers’
DF <- data.frame(colors = c('red', 'green', 'blue'), numbers = c(42.1, 2L, 10))
type <- 'histogram'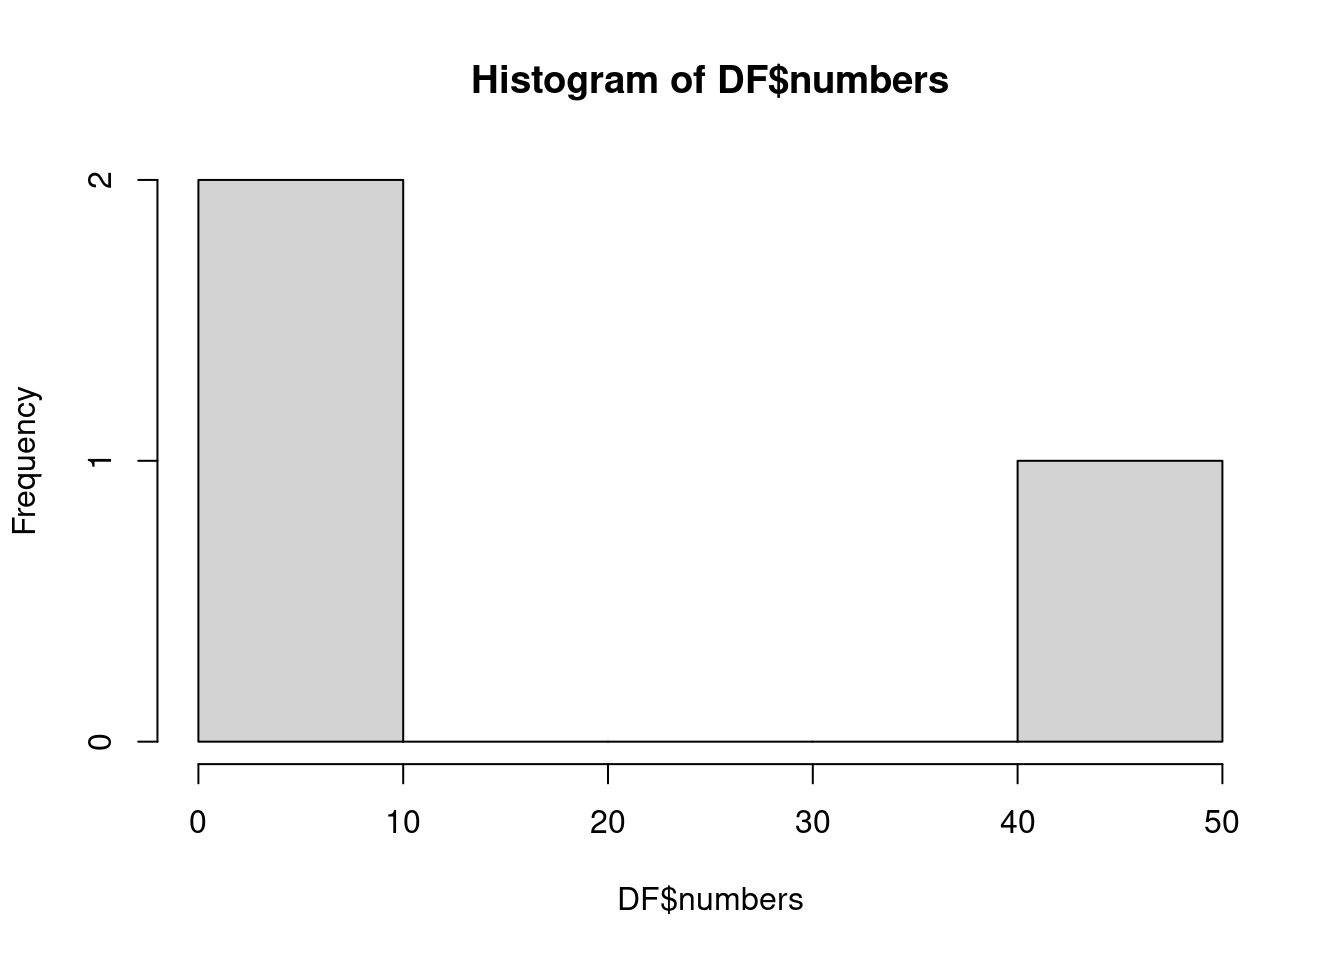
Conditional counts
Next we’ll write a new function that processes our prepared CSV files.
Let’s say we wanted to summarize the number of adults and chicks counted by island. First, write a function to sum the ‘adults’ and ‘chicks’ columns in the data.frame. Use the example data that we prepared with our prepare_csv function.
Follow the steps from our approach to developing functions:
- Setup the function
- Make a function script in the
R/directory namedsum_counts.R - Write the function’s skeleton (name, arguments, curly braces)
- Make a function script in the
- Setup the test script
- Make a corresponding test script in the
tests/directory namedtest_sum_counts.R. - Load any required packages (
library(package)) - Source the function (
source('R/function.R)) - Load example data and/or arguments for the function
- Make a corresponding test script in the
Since we have already built a function for preparing CSV files, use it in your test script:
path_counts <- file.path('raw-data', 'adelie-adult-chick-counts.csv')
prep_counts <- prepare_csv(path_counts)
Add a new section ‘Development’ in the test script (tests/test_sum_counts.R) to develop the body of your function. Use the prepared CSV data as shown above, add the code to your function sum_counts() and test!
Hints: by
{data.table} has an argument by
{dplyr} has an alternative to group_by for passing character column names called group_by_at
Next steps:
- decide if it is better for you (or a potential user) to set the columns that we calculate the sum by inside the function (fixed) or as an argument (flexible) - try both options
- add a filter argument
filter_gt_year(default set to NULL) and when it is not NULL, filter the data only greater than the value provided
Test these as you go in your test script tests/test_sum_counts.R.
Hints: defaults
To set a function’s argument to default, use the syntax argument = default_value. For example:
function(x = 1, y = 2, z = 3) {

}
Bonus
Add checks to your functions plot_xy() and sum_counts():
- use the arguments
x_colandy_colto also update the axis labels inplot_xy()(base R) - use a new argument
color_colto provide a column inplot_xy() - build a plot function that plots the output of
sum_counts()