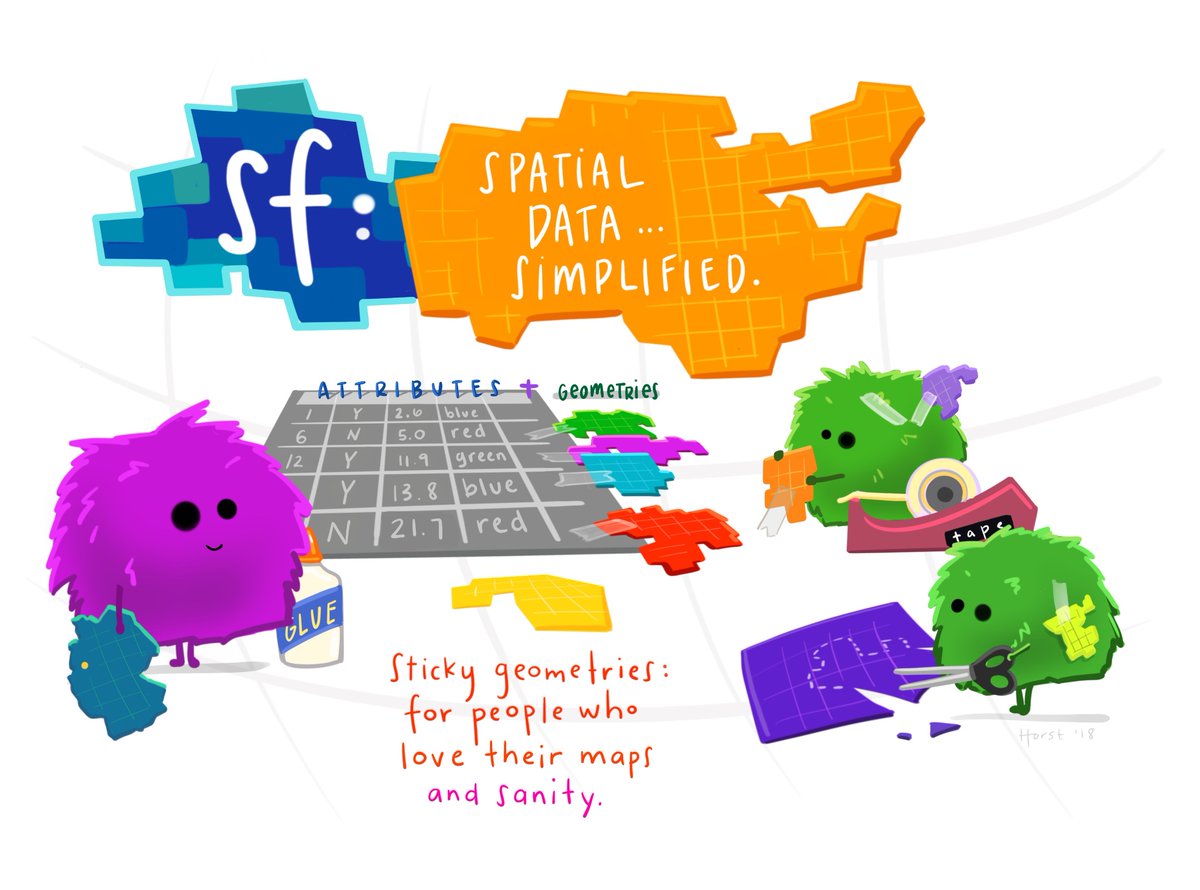
class: center, middle, inverse, title-slide # Data + R ## Epi Lunch & Learn ### Alec Robitaille ### 2019-05-29 --- # Good practices with data -- Keep raw data raw -- Keep track of where the data comes from -- No spaces, weird characters or symbols in file names or column names -- Use a consistent folder structure ```{} data ├── derived-data │ └── 1-prep │ └── cleaned-ed-visits.Rds └── raw-data └── ED visits for Alec.xls ``` --- # Good practices with R -- Use [RStudio projects](https://csgillespie.github.io/efficientR/set-up.html#project-management) -- Use [relative not absolute paths](https://www.tidyverse.org/articles/2017/12/workflow-vs-script/) -- Comment scripts throughout, [keep track of changes](http://github.com/) -- Use a common project structure ``` project/ ├── data/ │ ├── derived-data/ │ └── raw-data/ ├── graphics/ ├── R/ ├── epi-lunch-learn.Rproj └── README.md ``` -- [An example](https://github.com/wildlifeevoeco/SocCaribou) --- # Tidy data --  -- * Packages are designed to work with tidy data (`dplyr`, `ggplot2`) * Handles challenges like inconsistent number of diagnoses * Data is unambiguous --- # Functions Do you find yourself copy+pasting code, repeating lines on subsets of a data set, across different projects... .pull-left[ `WhitehorseMeans.R` ```r a2015 <- abs(mean(b2015) - b2015) a2016 <- abs(mean(b2016) - b2016) a2017 <- abs(mean(b2017) - b2015) a2018 <- abs(mean(b2018) - b2018) ``` ] .pull-right[ `DawsonMeans.R` ```r c2015 <- abs(mean(d2015) - d2015) c2016 <- abs(mean(d2016) - d2016) c2016 <- abs(mean(d2017) - d2015) c2018 <- abs(mean(d2018) - d2018) ``` ] -- Problems... -- * a greater risk of typos = hidden errors * more lines of code = lost in your scripts * more typing = tiring, [carpal tunnel](https://www.youtube.com/watch?v=fhauC2TwgxI) * can't use in other projects or scripts = not reusable * any change you make has to be made everywhere --- # Alternatively.. -- #### Write a function ```r calc <- function(b) { abs(mean(b) - b) } a2015 <- calc(b2015) a2016 <- calc(b2016) # ... ``` -- ### and apply that function over a list ```r lsYears <- list(b2015, b2016, b2017, b2018) lapply(lsYears, calc) ``` -- ### Or across groups ```r bees %>% group_by(year) %>% calc(val) ``` --- # Plotting .pull-right[] -- ## `ggplot` -- ## `geom_*` What kind of plot? (points, lines, histograms, ...) -- ## `aes` Links the data to aesthetic properties. * ID -> color * Treatment -> linetype * value -> point size -- ```r ggplot(mtcars) + geom_point(aes(mpg, cyl)) ``` --- # Spatial methods  * [`sf`](https://github.com/r-spatial/sf/) --- # Resources * [Advanced R](http://adv-r.had.co.nz/) * [Efficient R](https://csgillespie.github.io/efficientR) * [R for Data Science](https://r4ds.had.co.nz/) ## Extras * [RMarkdown](http://rmarkdown.rstudio.com/) * [data.table](https://cran.r-project.org/web/packages/data.table/) * [GitHub](http://github.com/) <!-- ## Questions * What are some advantages of using an R project? * Basic project/folder structure * What is a function * Examples of functions in R * Why write functions * long vs wide data * tidy data defined -->