library(ggplot2)
N <- 100
some_trees <- data.frame(
height = runif(N, 0, 5),
leaf_color = sample(c('red', 'brown', 'yellow'), N, replace = TRUE)
)
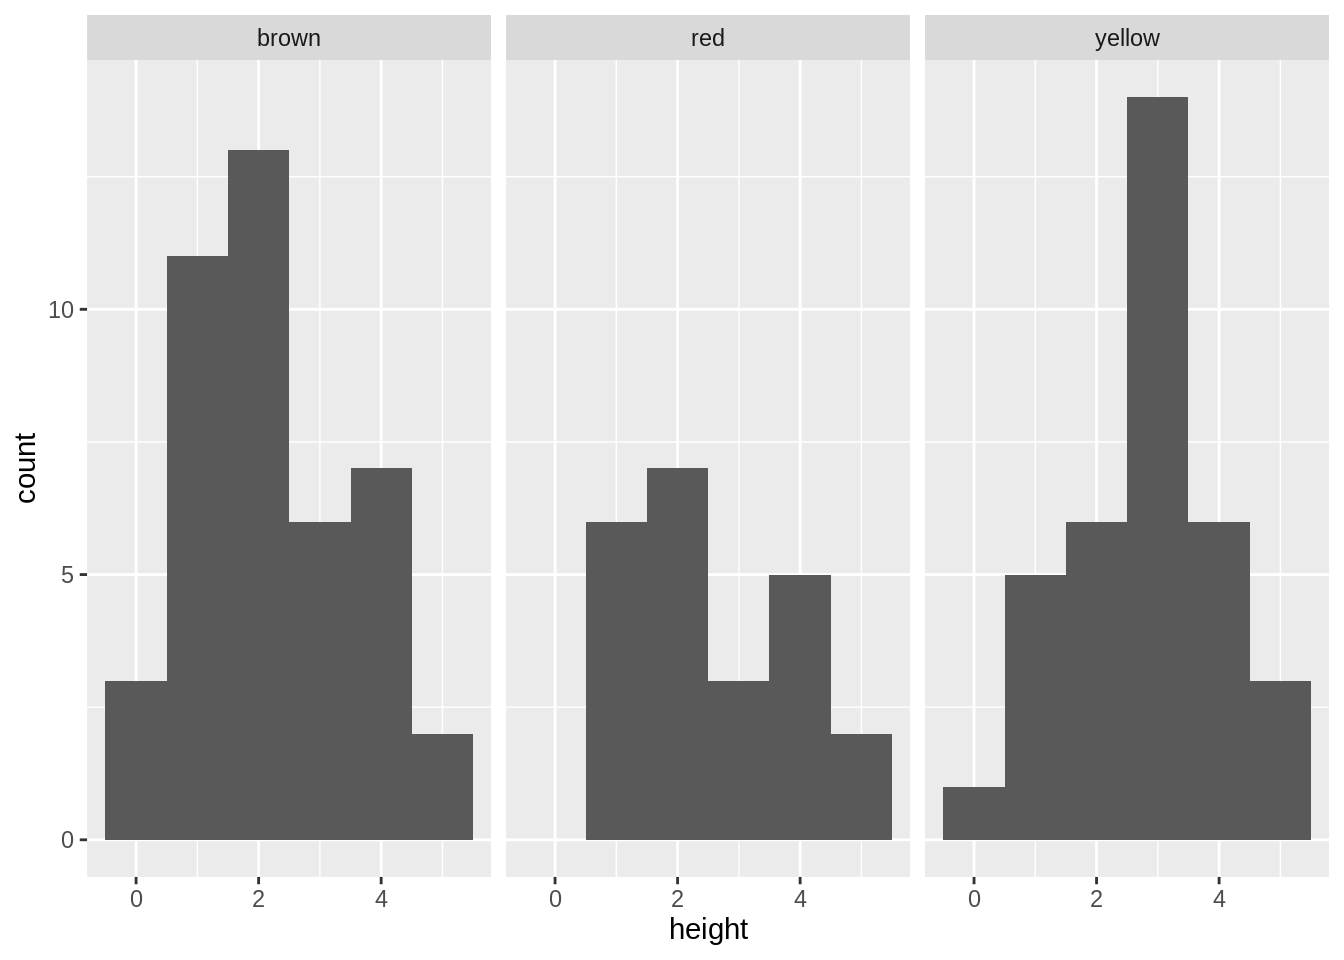
ggplot(some_trees, aes(height)) +
geom_histogram(binwidth = 1) +
facet_wrap(~leaf_color)